Data Modeling Explained: From Messy Spreadsheets to Star Schema
4 min readSaurabh Srivastava
A real-world guide for anyone working with hiring data (or any data, really)
If you work in Talent, HR, or Engineering Analytics, you’ve probably wrestled with messy data. You have simple questions like “How many people did we hire?” or “Which recruiter is performing best?” — but getting clean answers feels harder than it should be.
The problem isn’t your skills. It’s your data model.
Let me show you exactly what that means, using a real hiring scenario.
The Scenario: Your Hiring Data Challenge
You need to answer basic questions:
- How many people did we hire?
- How long did it take to hire them?
- Which recruiter is performing better?
- Which location is struggling?
You have all the data. But something feels… off.
Let’s walk through three different ways to organize this data — and why only one actually works.
Step 1: The Raw Data Trap (Where Most People Start)
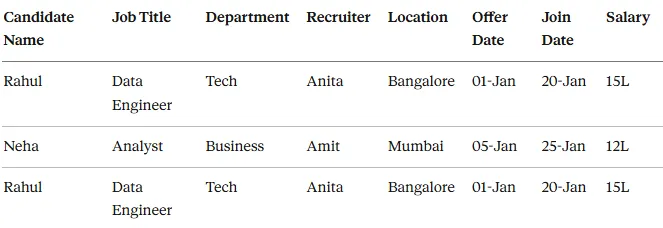
Here’s what your data probably looks like right now — one big Excel file:
Raw_Hiring_Data
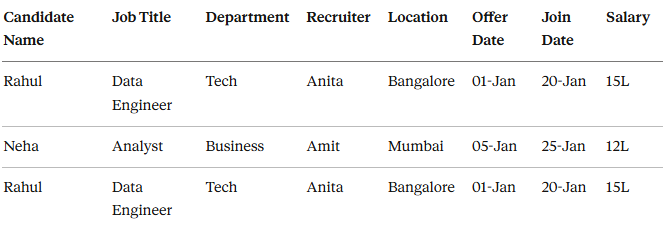
The Problems Are Obvious:
❌ Names repeat constantly ❌ Location repeats for every row ❌ Recruiter information duplicated everywhere ❌ Calculating “time to hire” means manual work ❌ Filters break when data grows
This is called a flat model or raw data structure.
Reality check: It’s good for data storage. Terrible for analytics.
Step 2: The Normalized Approach (Engineering Thinking)
Now you think: “Why am I repeating the same information over and over?”
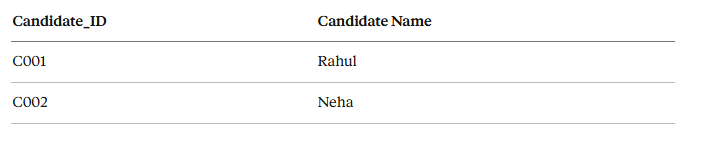
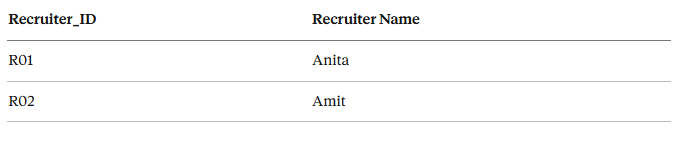
So you split the data into logical tables:
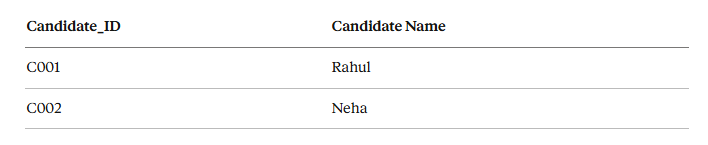
Candidate Table
Recruiter Table
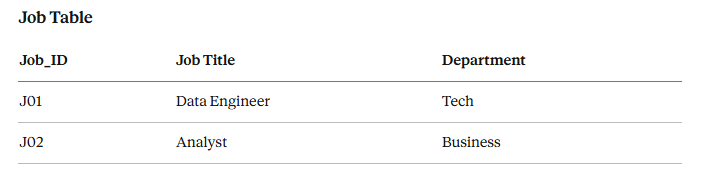
Job Table
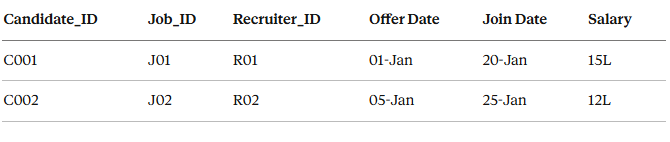
Hiring Table (connects everything)
This is the relational/normalized model.
✅ More accurate ✅ No data duplication ❌ But: Every dashboard query needs multiple joins ❌ Slow performance ❌ Confusing for non-technical users
Good for databases. Not ideal for analytics.
Step 3: The Star Schema (This Is the Game-Changer)
Now we design specifically for analytics, not storage.
The Core Concept (Read This Twice):
Fact Table = Your numbers (metrics, measurements) Dimension Tables = Your details (filters, context)
FACT TABLE: Where Your Numbers Live
Fact_Hiring
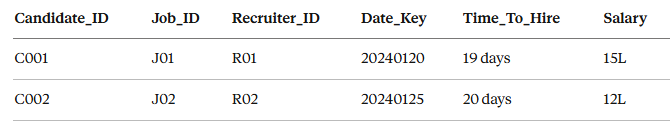
👉 One row = One hiring event
DIMENSION TABLES: Your Context and Filters
Dim_Candidate
Dim_Job
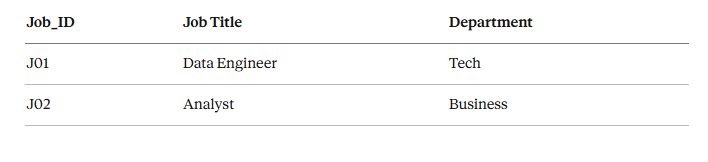
Dim_Recruiter
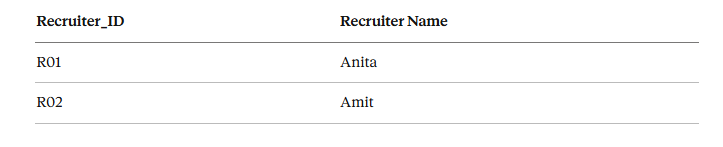
Dim_Date
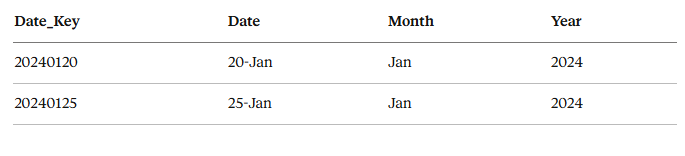
Step 4: How Everything Connects
Think of it literally like a star:
- Fact table sits in the center (the numbers)
- Dimension tables connect around it (the context)
- One-to-many relationships from dimensions to facts
This is why it’s called a Star Schema. It actually looks like a star.
Step 5: Why This Works So Well in Real Life
Now answering questions becomes ridiculously easy:
Question 1: Average Time to Hire by Recruiter
- Filter by Recruiter Name (from Dim_Recruiter)
- Calculate
AVG(Time_To_Hire)from Fact table - Done.
Question 2: Total Hires by Department
- Filter by Department (from Dim_Job)
- Count rows in Fact table
- Done.
Question 3: Hiring Trend by Month
- Use Date dimension
- Group by Month/Year
- Done.
No confusion. No broken filters. No weird results.
Step 6: Why Power BI, Tableau, and Looker Love This
These tools are designed for star schemas because:
✅ One clear fact table (no ambiguity) ✅ Clean, defined relationships ✅ Measures calculate correctly every time ✅ Performance is fast ✅ New users can understand it quickly
Hard truth: If your data model is wrong, your dashboard will always feel wrong — no matter how pretty you make it.
My Simple Test for a Good Data Model
If someone new can open your model and understand “what’s a fact vs what’s a dimension” in 5 minutes → good model.
If they need explanation every time → bad model.
That’s it.
The Bottom Line
Data modeling isn’t about fancy terminology or complex theory.
It’s about organizing data so questions become easy to answer.
If asking simple questions feels hard, your model is wrong. Simple as that.
What’s Next?
This was the foundation. Next topics I can cover:
- How to handle slowly changing dimensions (like when a recruiter changes teams)
- Snowflake schema vs Star schema
- Real Power BI implementation of this exact model
- Common mistakes that break everything
Let me know what you want to see next.
Have questions about your own data model? Drop them in the comments. I read and respond to all of them.
Cubed
Write about the technologies shaping the future.
For developers, founders, and curious minds exploring AI, crypto, Web3, and emerging tech—signal over noise.
One free account across In Plain English, Stackademic, Venture, and Cubed.
How it works- AI, crypto & Web3
- Software & emerging technologies
- Analysis & practical resources
- Thoughtful voices, not hype
Sign in
Google or GitHub
Complete profile
Takes a few minutes
Get approved & publish
Start sharing
Why write for Cubed?
The future deserves thoughtful voices, not just louder headlines.
Comments
Loading comments…